How-To: Monitor the Keyserver from the Dashboard
The Dashboard (/dashboardadmin) is the page every subject lands on after login. This page explains what each card shows and what its numbers mean.
The page loads for everyone; the data does not
Any authenticated subject can open the dashboard, but its statistics require a role granting the getstatistics permission. The administrative and reviewer Natures carry it; user does not.
Without it the page still renders, with zeros, empty charts and Invalid Date, and no error. If the numbers look empty, check the subject's role first.
Prerequisites
- Access to the Keyserver UI at
https://keyclient.<UNIQUE-ID>.cryptera-security.io - A role granting
getstatistics
How the data is refreshed
The dashboard is fed by one statistics call per page load, covering a fixed 7-day window. The window cannot be changed and the page does not refresh itself; reload it for current figures. The Approvals, Keys and Subjects cards have a list icon (top right) that opens the matching page.
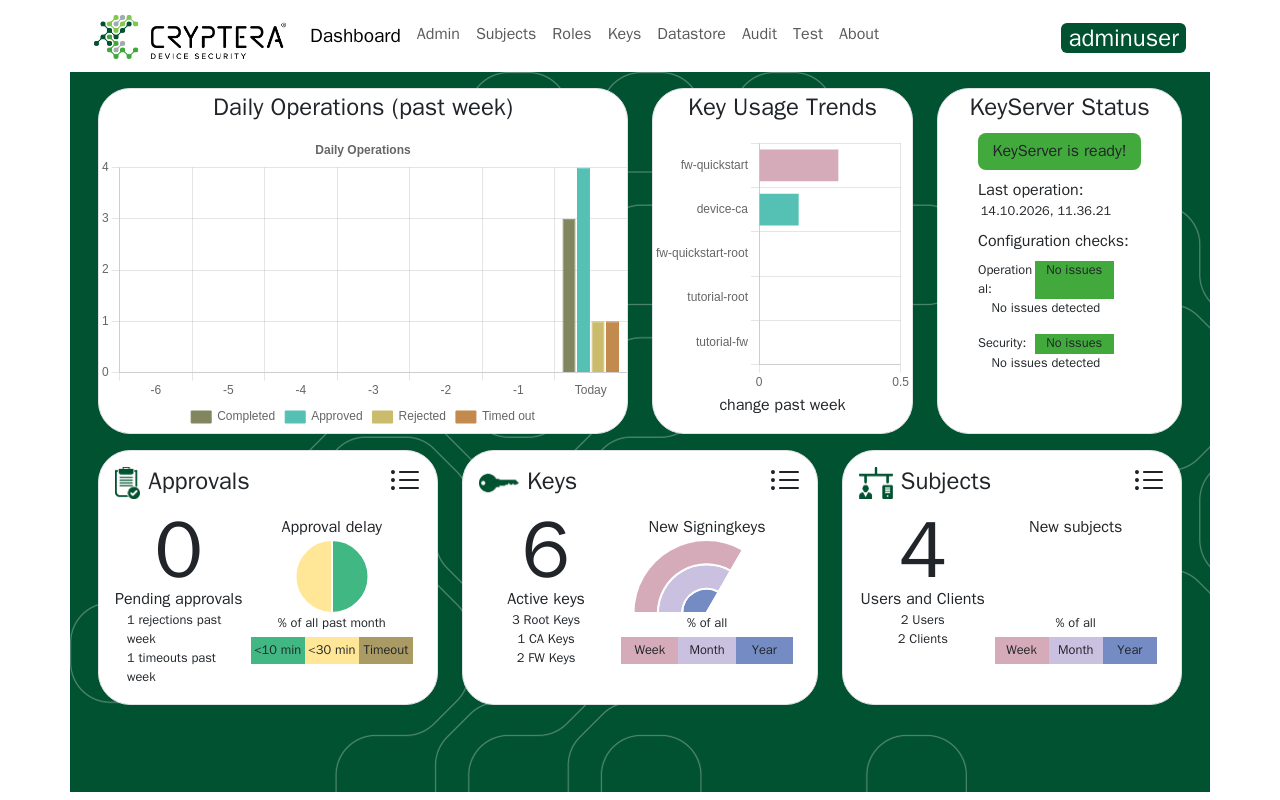
The six cards sit in two rows:
- Top row: Daily Operations, Key Usage Trends, KeyServer Status
- Bottom row: Approvals, Keys, Subjects
Daily Operations
A grouped bar chart with one group per day over the past week, oldest first. Each group has four series, Completed, Approved, Rejected and Timed out, counting signing operations in each state. The series overlap (one operation can count in several), so daily totals will not match audit-log counts.
Key Usage Trends
A horizontal bar chart labeled "change past week", showing the five keys with the largest trend magnitude, positive or negative, labeled by key ID. Each key's value is:
Positive means above the key's yearly average, negative means below.
KeyServer Status
Shows a "KeyServer is ready!" banner and Last operation: the creation timestamp of a recent signing operation, as a rough liveness indicator. For the exact time something last happened, use the Audit Log.
Below that, two configuration-check rows, Operational and Security, each read "No issues" or a count. When a count is above zero, an info button next to the row opens a list of each warning and the objects it concerns.
- Operational warnings flag configuration gaps that can block key usage, for example a key that no subject may create operations for, or a key that requires more approvers than there are subjects allowed to approve it. The modal's subtitle says these "may block operations, but aren't directly security critical".
- Security warnings flag separation-of-duty conflicts, for example one subject holding ordering permission and
approveon keys of the same type (FW or CA). The check does not compare key IDs or Required Approvers. The modal's subtitle says these "are potentially security critical or in conflict with best practice".
Approvals
The big number is pending approvals: operations still awaiting approval on keys the viewer can approve. See Set Up and Run Approval Workflows. Below it are the rejections and timeouts over the past week.
The "Approval delay" pie shows how quickly recent approvals were granted, bucketed by elapsed time. It is an indication only: the bucket boundaries and the window shown on screen do not always match the underlying count.
Keys
The big number is the signing-key count, broken down into Root / CA / FW. The "New Signingkeys" half-doughnut shows keys created this week, this month and this year, each as a share of all keys.
Counts include revoked keys
Signing keys are never deleted, only revoked, and revoked keys are counted here. The Keys page shows which keys are usable.
Subjects
The big number is the subject count ("Users and Clients"), broken down into users and clients. Deleted subjects are counted too; the Subjects page shows the current list. The "New subjects" half-doughnut follows the same week/month/year pattern as the Keys card.
If something looks wrong
The cards render only once the statistics call returns. A blank dashboard usually means that call failed, most often because the login session expired. Sign out and back in. If the dashboard is still blank, check the browser console for the failing request.
The About page
About (in the navigation bar) needs no administrative session or special permission. It shows the product version, build number and build details; quote these when contacting Cryptera support. Below that, the license section shows the maximum number of signing keys and which licensed features are enabled: firmware signing, device certificates, keystore and datastore.
If you logged in interactively, an OAuth2/OIDC section offers "View ID Token" and "View Access Token", each decoding the token into a table of its claims. Use them to troubleshoot a subject-mapping mismatch. See Diagnosing 401 vs 404 vs 403. An API info section links to the interactive Swagger UI. See Interactive API Reference.
Related pages
- Monitor and Filter the Audit Log: the event-by-event record behind the aggregate counts
- Approval Workflow: what pending, approved, rejected and timed-out operations mean